Turn GoldenCheetah Activities into a Heatmap with PMTiles
I use GoldenCheetah to manage my running activities. Think something like
Strava, but fully local and with the ability to add graphs and overviews that
you care about. Some assembly required. One advantage of having it local means
you also have all the files local. This in turn makes it easy to use all that
data for other ideas. Idea of the day: using the data and turn it into a
heatmap. Technology of choice: Protomaps and their pmtiles files. How it will
happen: (1) a quick Python script to turn the GoldenCheetah files into geojson
files (2) feed geojson to tippecanoe (3) add the data to the map.
If you have your running, biking, walking, whatever activities in another format and know how to convert them to GeoJSON yourself, then the rest of the post might still prove useful for you. A GPX to GeoJSON converter should be simple enough. A FIT file to GeoJSON converter maybe not.
I am on a roll tinkering with Protomaps, so that was my weapon of choice here. First I wrote a little intro to how I use Protomaps and that was followed up by trying to style Protomaps. I will admit some of this tinkering happened 2-3 months ago, but hey, posting here makes it official. Now back to the subject of this post.
GoldenCheetah to GeoJSON
GoldenCheetah lets you import activities in a variety of formats. They get
converted and saved as json files following their own defined structure. The
files are saved in the activities/ folder in your GoldenCheetah profile
folder. These files are easy enough to read. This is the skeleton with
information of one such file that I am interested in for this post. The files
contain a lot more information, evidently.
{
    "RIDE": {
        "STARTTIME": string,
        "TAGS": {
            "SPORT": string,
        },
        "SAMPLES": [
            { "LON": number, "LAT": number },
            ...
        ]
    }
}
For the next step, I want GeoJSON files. At first I whipped together some
magical jq incantation for this conversion, but that seemed impossible to
maintain, so instead I ended up writing a Python script.
Specifically, this script creates three files: bike.geojson, run.geojson,
and walk.geojson. Each file is a FeatureCollection containing many
Features, each representing one activity. A feature has a LineString as
geometry (based on the SAMPLES in the GoldenCheetah file). It also gets a
start and a sport as properties. The script does this by reading all the
GoldenCheetah files, collecting the activities as it goes and splitting them by
the SPORT value. In my case, this is Bike, Run, and Walk. This is
however not mandated by GoldenCheetah, so you might have to adjust the Python
script to match what you use. Nothing magical happens here, just reads,
parses, writes out again.
The script does not require you to install any Python libraries, I am not
sadistic enough to want to put you through that ordeal. Luckily Python is
json batteries included. If you happen to have tqdm installed, you will get
nice progress bars while the parsing happens.
import json

# Make tqdm optional dependency. If it isn't, we just will not have a progress bar.
try:
    from tqdm import tqdm
except ImportError:

    def tqdm(x):
        return x


def read_activity(f):
    """Reads in GoldenCheetah formatted .json file, creates a geojson Feature from it"""
    data = json.load(f)
    try:
        start = data["RIDE"]["STARTTIME"]
        sport = data["RIDE"]["TAGS"]["Sport"].strip()
        samples = data["RIDE"]["SAMPLES"]
        coords = [
            [sample["LON"], sample["LAT"]]
            for sample in samples
            if "LON" in sample
            and "LAT" in sample
            and not (sample["LON"] == 0 and sample["LAT"] == 0)
        ]
    except KeyError:
        return None

    if len(coords) == 0:
        return None

    return {
        "type": "Feature",
        "properties": {
            "start": start,
            "sport": sport,
        },
        "geometry": {"type": "LineString", "coordinates": coords},
    }


def read_activities(filenames):
    bike = []
    run = []
    walk = []
    for filename in tqdm(filenames):
        with open(filename, "r", encoding="utf-8-sig") as f:
            activity = read_activity(f)
            if activity is None:
                continue
            if activity["properties"]["sport"] == "Bike":
                bike.append(activity)
            elif activity["properties"]["sport"] == "Run":
                run.append(activity)
            elif activity["properties"]["sport"] == "Walk":
                walk.append(activity)

    bike = {"type": "FeatureCollection", "features": bike}
    run = {"type": "FeatureCollection", "features": run}
    walk = {"type": "FeatureCollection", "features": walk}

    return (bike, run, walk)


def write_geojson(filename, geojson):
    with open(filename, "w") as f:
        json.dump(geojson, f)


if __name__ == "__main__":
    import glob

    filenames = glob.glob("./activities/*.json")
    print("Read activities")
    (bike, run, walk) = read_activities(filenames)
    print("Write geojsons")
    write_geojson("bike.geojson", bike)
    write_geojson("run.geojson", run)
    write_geojson("walk.geojson", walk)
I have this script as gc-to-geojson.py. I only mention it, because later I
will also include my Makefile which relies on the file having that name. If you
do not need the Makefile or can adjust it, then pick whatever you want to name
it. The script assumes it is run from a folder with an activities/ folder
inside it where that folder holds all the GoldenCheetah json files.
I have a lot of activities, nearly 5000. In my case the three GeoJSON files had
the following sizes: running 255MB, biking 60MB, and walking 56MB. If this
worries you, the pmtiles file will be significantly smaller. Once that is
created, you can get rid of these files if you want to.
Tippecanoe
Tippecanoe is a tool to turn GeoJSON into, amongst other filetypes, pmtiles
files. For every file you feed it, it will make it a different layer in the
resulting pmtiles file. In my case, I take the three files from the previous
step, feed them to Tippecanoe, and make it create one gc.pmtiles file. As I
found myself doing some of these steps over and over again, I added this quick
Makefile.
all: gc.pmtiles

gc.pmtiles: bike.geojson run.geojson walk.geojson
	tippecanoe --force --output=$@ $^

bike.geojson run.geojson walk.geojson: gc-to-geojson.py
	python gc-to-geojson.py

clean:
	rm -f gc.pmtiles bike.geojson run.geojson walk.geojson
The resulting gc.pmtiles file is just 15MB. Order of magnitude smaller than
the three GeoJSON files.
Adding to the Map
I assume you have the setup from my introductory post, i.e., a HTML page with the Leaflet library and with the correct Protomaps library added.
Adding the gc.pmtiles file will be done using the same
protomapsL.leafletLayer command that was used to add the base map in the
introductory post. Before doing that, I first define some styling to apply to
the data in gc.pmtiles. Now, in my previous styling post
I was a bit handwavy about the structure of a rule in a style schema. For this
one, I figured I should look it up. Here it is straight from the source.
export type Filter = (zoom: number, feature: Feature) => boolean;

export interface Rule {
  id?: string;
  minzoom?: number;
  maxzoom?: number;
  dataSource?: string;
  dataLayer: string;
  symbolizer: PaintSymbolizer;
  filter?: Filter;
}
dataLayer, symbolizer, and filter I described in the previous post. I am
not quite sure yet what id is used for. The zoom ones seem
self-explanatory. dataSource is, as far as I can tell, for when you add
multiple pmtiles files in one call to leafletLayer, but want a style to
only apply to just one of those files. It all does not matter for this purpose,
since I only end up using dataLayer and symbolizer.
The following styles will style the data in the bike layer as blue lines. The
run and walk layers both get red lines. For my mapping purpose I see them
as both working towards the same goal. I also paint them a bit wider than the
biking since I am more interested in them.
let run_rule = {
  dataLayer: "run",
  symbolizer: new protomapsL.LineSymbolizer({
    color: "red",
    width: 3,
  }),
};
let walk_rule = {
  dataLayer: "walk",
  symbolizer: new protomapsL.LineSymbolizer({
    color: "red",
    width: 3,
  }),
};
let bike_rule = {
  dataLayer: "bike",
  symbolizer: new protomapsL.LineSymbolizer({
    color: "blue",
    width: 1,
  }),
};
// Note the order here.
// Last rule gets painted on top of the others.
let gc_rules = [bike_rule, walk_rule, run_rule];
Then to actually add things to the map.
let gc_layer = protomapsL.leafletLayer({
  url: "gc.pmtiles",
  paint_rules: gc_rules,
});
gc_layer.addTo(map);
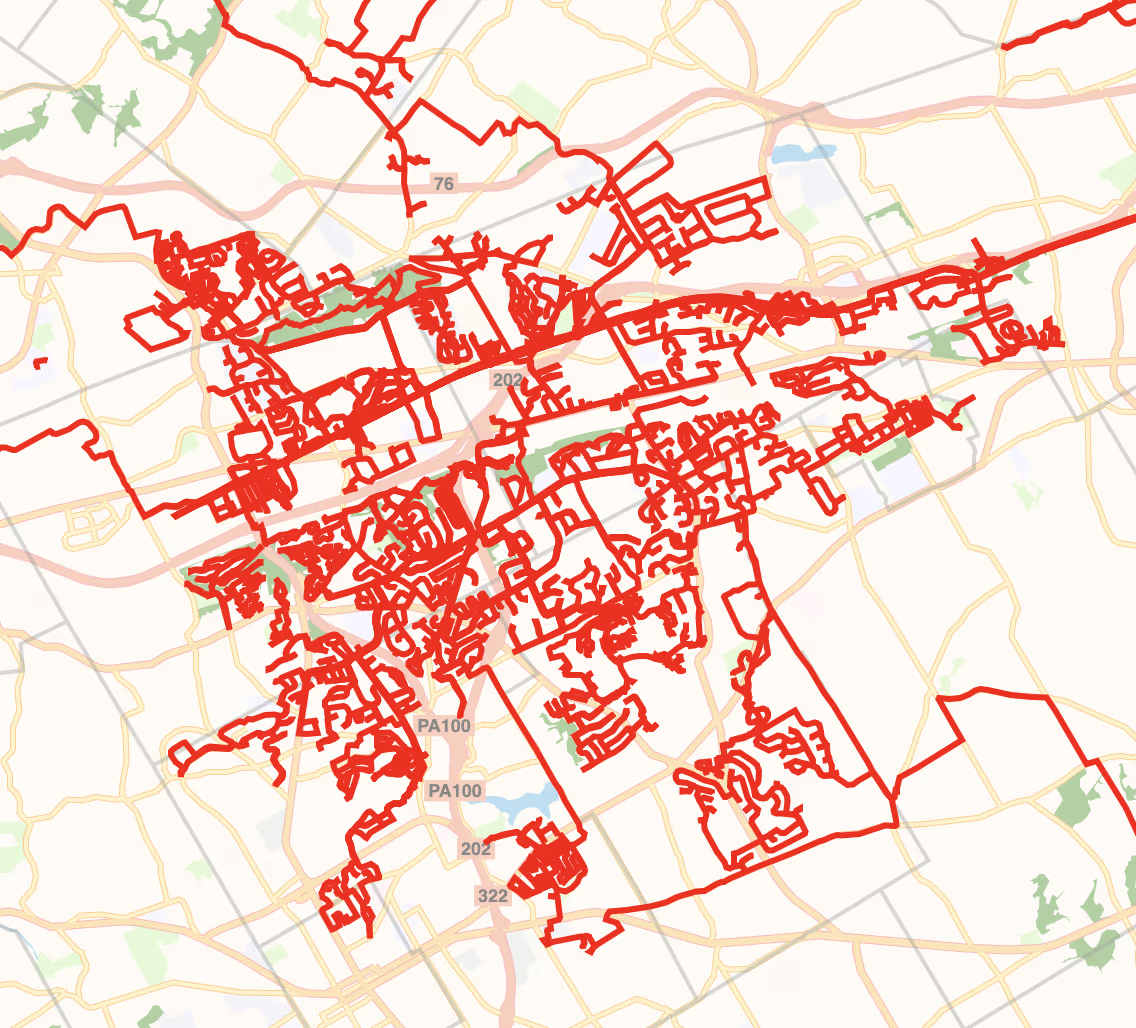
And here is how that looks. Only runs and walks are present on this section of the map, so do not look for a blue line.

Turning Layers On and Off
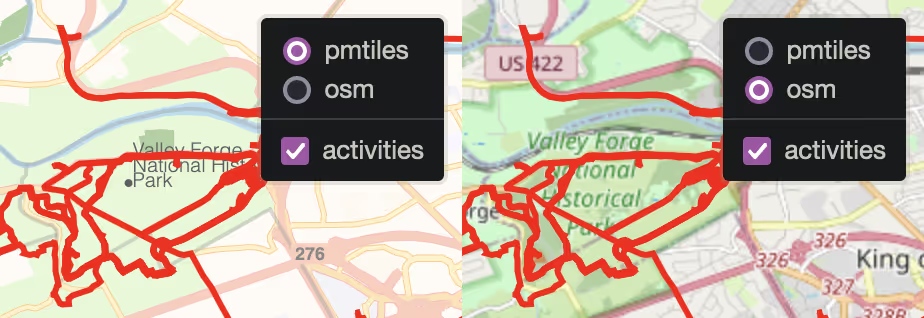
While playing around with this, I found out about the “Layers” control that Leaflet offers. You can feed it some layers of the map and it will put a control on the map where you can disable layers or switch between them in the case of basemaps.
At the moment there are two layers: layer is the basemap pmtiles file from
the introductory post and gc_layer is the layer of activities we just
created. For the purpose of showing off this control, you can add the following
to get an OpenStreetMap base layer.
// Fallback to OSM background.
var osm = L.tileLayer(
"https://{s}.tile.openstreetmap.org/{z}/{x}/{y}.png",
{
maxZoom: 19,
attribution:
'© <a href="http://www.openstreetmap.org/copyright">OpenStreetMap</a>',
},
);
Note the lack of an addTo(map). Instead, the layer will be fed to the Layers
control as an extra basemap. When looking at the map, you can then switch
between the default pmtiles basemap or the ol’ reliable OpenStreetMap
basemap. The gc_layer goes in the supplemental layers. This way it can also
be turned off if so desired. The given keys are the names in the control.
L.control
  .layers(
    // base layers: only one activated (radiobox)
    { pmtiles: layer, osm: osm },
    // supplemental layers: checkboxes
    { activities: gc_layer },
    // options
    { collapsed: false },
  )
  .addTo(map);
The control looks like this.

Possible Improvements
- There seems no built-in way to temporarily disable and enable a data layer
from a PMTiles file (so the bike, run, and walk in the
gc.pmtilesfile, not to be confused with the layers concept in Leaflet itself). The idea here would be to quickly toggle the presence of walks, runs, or biking. The solution I have in my head is to adjust thepaint_rulesproperty of a Protomaps-in-Leaflet layer. (so thegc_layeror thelayervariables from before). You can then callredraw()on the layer to do a repaint for the current view. It will use the newpaint_rules. If you do not callredraw, the new rules will still be used for any other painting that needs to be done, e.g., by panning or zooming. It feels a bit hacky though, so I might delve further into the source code to see if I spot something. - If you want extra information added to the activities, you will have to adjust the Python script. Maybe you want to colour runs by their speed, for example.
- If you want this part of a pipeline you run often-ish, then you might instead
want to create a script that creates one geojson file with one feature for
every GoldenCheetah json file. This way, files that have already been
parsed, do not need to be parsed again. Tippecanoe is forgiving with how you
give it the data, you can just
catGeoJSON files together into one and it will still figure it out for you. Thus those individual files can just be thrown together right before Tippecanoe conversion. I am not familiar enough with Tippecanoe to know whether you can just add a few more features to an existing PMTiles file.